Where and how often do Danish fishermen use trawls and other gears with seabed impact? The answer can be found in a mapping tool that DTU Aqua has developed.
With a few clicks in the mapping tool "The seafloor footprint of Danish fishing", it is possible to get an overview of where and how often Danish fishermen use otter trawls, beam trawls, demersal seines and mussel dredges.
For instance, you can find out how much of the Kattegat is affected by the Norway lobster fishery using otter trawls, or how much fishing activity takes place in a potential wind farm site within the Jammerbugt area. See the examples further down the page.
The mapping tool has many possible uses – from the assessment of a certain fishery's pressure on the seabed in a certain area to the implementation of Denmark's maritime spatial plan.
"We would like to make our knowledge available so that politicians, authorities, businesses and non-governmental organizations have access to the best data available in the field. And so that everyone has the same information available when, for example, it is discussed how the marine areas should be managed", says Postdoc Karin van der Reijden, DTU Aqua, who has developed the tool.
A high level of detail makes the map very useful
The mapping tool is unusually detailed compared to other fisheries distribution maps. They are typically divided into grid cells, which cover several square kilometers, whereas DTU Aqua's mapping tool works with a resolution down to 100 x 100 meters.
“As far as we know, the tool has the highest degree of detail of all, and the spatial resolution is more than 1000 times higher than on a standard map. This makes the results more precise and thus very useful within ecosystem and fisheries management", explains Karin van der Reijden.
The development of the tool is financed by the European Maritime and Fisheries Fund and the Danish Fisheries Agency in the project "Danish Fisherman-Researcher Network 3", which is a collaboration between DTU Aqua and Danish Fishers PO.
Link to the mapping tool
Go to the mapping tool "The seafloor footprint of Danish fishing"
See step-by-step instructions for using the mapping tool
Two examples of how the mapping tool " The seafloor footprint of Danish fishing" can be used
EXAMPLE 1: How much of Kattegat was subject to fishing by bottom trawls targeting Norway lobster in 2020?
In order to get an answer to this question in the mapping tool, you should select ‘Kattegat’ as the area, ‘Otter trawls/Norway lobster’ as the gear, and the year ‘2020’.
The results are shown partly on a map and partly in a table (see Figure 1). On the map, you can see that this fishery mainly took place in the eastern part of the Kattegat towards Sweden. The strength of the color on the map tells how often this location was fished each year – the darker, the more often.
The table shows that there were 123 active fishing vessels catching Norway lobsters with trawls. A total of 129 vessels fished in the area, so the Norway lobster fishery was clearly dominant. The table also shows that there was no fishing in 78% of the area in the Kattegat, i.e. 22% of the area was affected by fishery. Furthermore, the table shows that the fishing intensity was 4.105, which means that, on average, fishing was done more than 4 times a year in the part of the area where fishing takes place (the colored area of the Kattegat).
On the map, you can add several layers and thus show water depth and habitat types (MFSD). Here you can see that Norway lobster fisheries take place in the deep parts of the Kattegat and where there is a muddy seabed, and that fishing affects significantly more than 22% of exactly that type of seabed.
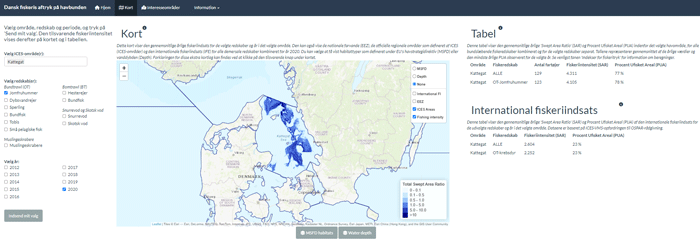
Figure 1. Result page from the mapping tool "Danish fishing's footprint on the seabed". Click to see larger version.
EXAMPLE 2: How active are bottom trawling fisheries currently in the area of Jammerbugt that has been designated as a possible wind farm?
To get an answer to that question, select the 'Areas of interest' tab in the mapping tool and then 'Off-shore wind farms'. Next, Jammerbugt should be selected as the area as well as all available gear types. You should also select year, e.g. the two most recent ones available in the current version of the tool (2019 and 2020).
The results are shown partly on a map and partly in a table (see Figure 2). The colors of the map show how often the location was fished annually – the darker, the more often.
The table shows that 23 fishing vessels were active in the area in the two selected years and that 37% of the area was not fished, i.e. there was fishing activity in 63% of the area. The table also shows that the fishing intensity was 1.86, which means that fishing was done on average 1.86 times a year in the part of the designated area where there was fishing activity.

Figure 2. Result page from the mapping tool "Danish fishing's footprint on the seabed". Click to see larger version.