Mapping tool: The seafloor footprint of Danish fishing
Where and how often do Danish fishermen fish with bottom-towed gears? The answer to that can be found in the mapping tool “The seafloor footprint of Danish fishing”, which DTU Aqua has developed.

2021-2025
2012-2020
What can the tool be used for?
The interactive mapping tool “The seafloor footprint of Danish fishing (FPLADS)” shows the distribution and intensity of the fishing activity by Danish fishing vessels that use various bottom-towed fishing gears.
This information could serve as a shared knowledge base for all kinds of marine policy and management issues, ranging from fishing impact assessments to marine spatial planning.
The spatial resolution of the mapping tool (pixels of approx. 60 x 100 meters) is more than 1000 times higher than that of standard maps of fisheries distribution and intensity, making the results more accurate.
Whom is the tool aimed at?
The mapping tool is primarily aimed at professionals with expertise in fisheries and the marine environment working at authorities, businesses, interest organizations, or knowledge and teaching institutions.
What does the tool contain?
The mapping tool generates maps and tables that indicate where Danish fishing activities with bottom-towed gears take place, and how often. Users can select the geographical area, the type of fishing gear, and the years of interest.
The information can be displayed at different geographical levels, from large sea areas to small, distinct areas such as specific Natura 2000 sites, offshore wind farm locations, other protected areas, and any future areas that are proposed to be closed to fishing, etc.
The user can select specific fisheries, e.g. fishing with mussel dredges or otter trawling for Norway lobsters as well as different years and periods from 2021-2024.
How is data displayed?
The mapping tool returns three types of results for the selected area, fishery, and period:
- a map showing the spatial extent and intensity of the Danish fishing activity.
- table(s) presenting numerical values of the distribution and intensity of the Danish fishing activity.
- a graph showing both annual and multi‑year percentage values of area impact for habitat types and areas of interest.
Fisheries covered by the tool
The following gears and fisheries are covered by the mapping tool:
- Otter trawls: Norway lobster – Deep-water prawn – Norway pout – Demersal fish – Sandeel – Small pelagics
- Beam trawls: Brown shrimps – Demersal fish
- Demersal seines: Anchor/Danish seine – Scottish seine/fly dragging
- Dredges
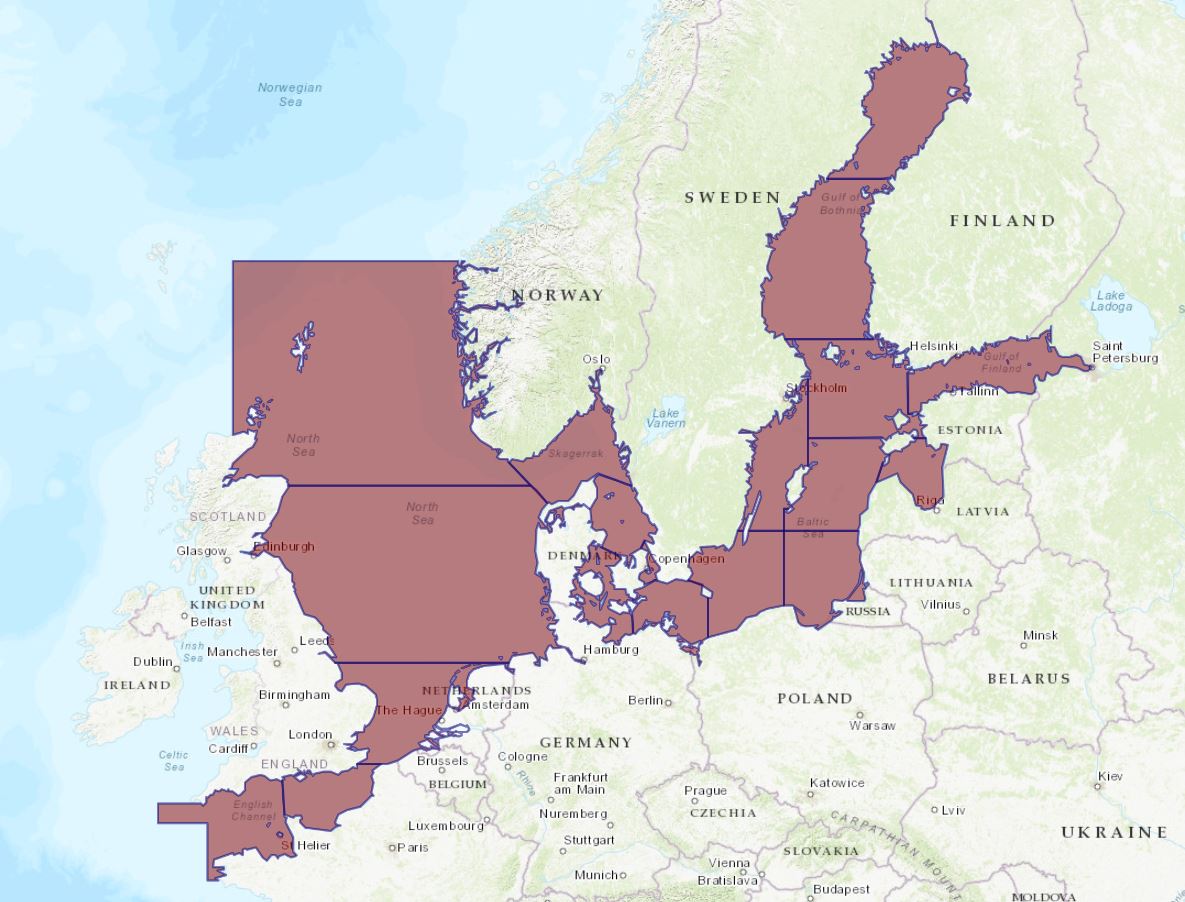
Areas covered by the tool
The map shows the areas covered by the tool.
Funding
The development of the mapping tool has been financed by the European Maritime and Fisheries Fund and The Danish Veterinary, Food, Agriculture and Fisheries Agency in the project “Dansk Fisker-Forsker Netværk 3”, which was a coperation between DTU Aqua and Danish Fishermen PO. Maintenance and updating of the mapping tool are handled by DTU Aqua.
Help and inspiration
Here you will find help and inspiration on how to use the mapping tool.
Contact
Jeppe Olsen Senior Officer National Institute of Aquatic Resources Mobile: +45 93511453 jepol@aqua.dtu.dk
Contact
Ole Ritzau Eigaard Senior Researcher National Institute of Aquatic Resources Mobile: +45 21154565 ore@aqua.dtu.dk